Use of this Map:
The composite Groundwater Contamination Susceptibility Map can be used by state agencies and others when deciding where they should more closely study impacts on groundwater. Local officials can also use this in determining whether they should study their region in more detail for potential groundwater problems. The groundwater contamination susceptibility map can be combined with other planning tools such as land use maps, groundwater quality data and contamination source information to help make sound groundwater management and land use decisions.
The Groundwater Contamination Susceptibility Map of Wisconsin doesn’t show areas that will be contaminated, or areas that cannot be contaminated. Whether an area will have groundwater contamination depends on the likelihood of contaminant release, the type of contaminants released and the sensitivity of the area to the contamination. In turn, the likelihood of contaminant release depends on the type and intensity of the land use and contaminant sources in an area.This map highlights areas sensitive to contamination and shows them in a generalized way.
There are many limitations in the use of this composite map. It is compiled from very generalized statewide information at a small scale, and therefore, cannot be used for any site specific purposes. For example, siting waste disposal facilities or locating an industry requires site-specific, geologic and hydrogeologic information, and can’t be made based on this composite map. The Groundwater Contamination Susceptibility Map doesn’t consider the individual characteristics of specific contaminants or the subsurface release of contaminants. That is, it only considers the ability of water to move from the land surface to the water table.
Map source: Schmidt, R.R., 1987, Groundwater contamination susceptibility map and evaluation: Wisconsin Department of Natural Resources, Wisconsin’s Groundwater Management Plan Report 5, PUBL-WR-177-87, 27 p.
More information about individual data layers can be found in this guidance.
County data: Wisconsin Department of Natural Resources, 2004, 1:24,000 digital data, Wisconsin Transverse Mercator Projection, North American Datum of 1983 (1991 adjustment).
Lake and stream data: U.S. Geological Survey, 2003, 1:2,000,000 digital data, North American Datum of 1983.
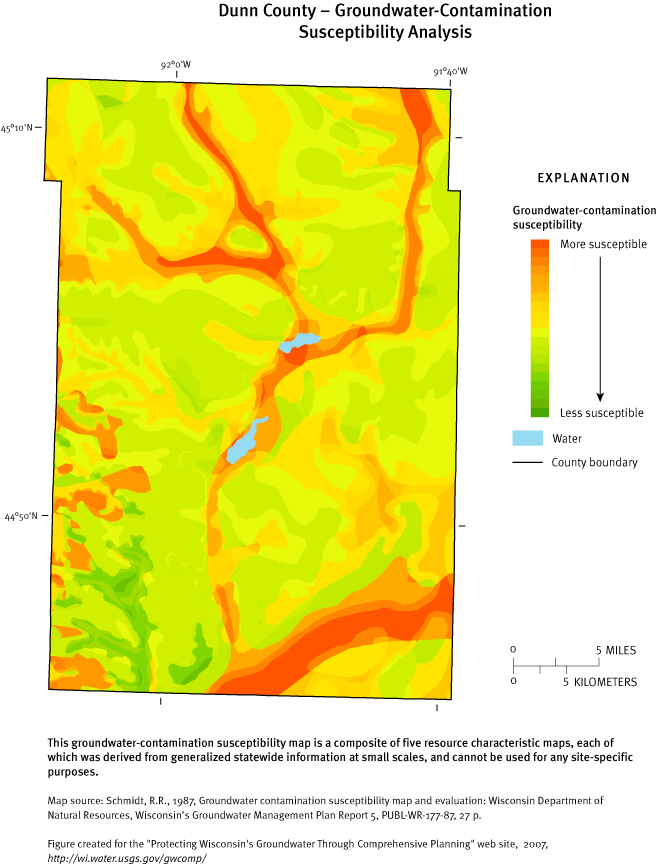
In Wisconsin, 70% of residents and 97% of communities rely on groundwater as their drinking water source. Wisconsin has abundant quantities of high-quality groundwater, but once groundwater is contaminated, it’s expensive and often not technically possible to clean. Because of these factors, we need to be careful to protect our groundwater from contamination. Our activities on the land can contaminate groundwater - most contaminants originate on the land surface and filter down to the groundwater. In some cases however, groundwater can become contaminated from natural causes such as radioactivity due to the presence of radium in certain types of rocks.
“Susceptibility of Groundwater to Pollutants” is defined here as the ease with which a contaminant can be transported from the land surface to the top of the groundwater called the “water table”. Many materials that overlie the groundwater offer good protection from contaminants that might be transported by infiltrating waters. The amount of protection offered by the overlying material varies, however, depending on the materials. Thus, in some areas, the overlying soil and bedrock materials allow contaminants to reach the groundwater more easily than in other areas of the state.
In order to identify areas sensitive to contamination, the Wisconsin Department of Natural Resources, in cooperation with the University of Wisconsin Extension, Wisconsin Geological and Natural History Survey and the USGS, has evaluated the physical resource characteristics that influence this sensitivity.
Five physical resource characteristics were identified as important in determining how easily a contaminant can be carried through overlying materials to the groundwater. These characteristics are depth to bedrock, type of bedrock, soil characteristics, depth to water table and characteristics of surficial deposits. Existing statewide maps of these five characteristics were used whenever possible. New maps were compiled when existing information wasn’t already mapped. The resource characteristic maps used in this project were compiled from generalized maps at a scale of 1:250,000 or 1:500,000.
Each of the five resource characteristic maps was put into digital form using a Geographic Information Systems (GIS) program. All of the information contained in the five maps was overlaid and combined into one composite map. A numeric rating scheme developed for each map was used to score the maps and the five resource map scores were added together within GIS. The composite map shows the scores for each area – low scores represent areas that are more susceptible to contamination and high scores represent areas that are less susceptible to contamination.
The method described above is a subjective rating method; specifically an index method. An index method assigns a subjective ratings or score to physical resource characteristics of an area to develop a range of contamination susceptibility categories (ranging, in this case, from more susceptible to less susceptible). Index methods are fairly popular approaches to groundwater susceptibility, because they are quick and straightforward, and they use data that are readily available. However, the mapped distribution of susceptibility categories produced by an index method is typically fraught with uncertainty, primarily due to the subjectivity in the approach. The susceptibility categories include little quantifiable or statistical information on uncertainty and this limits their use for defensible decision making. So while susceptibility maps produced using index methods can be useful, their inherent uncertainty must be kept in mind. (National Research Council, 1993; Focazio and others, 2002).
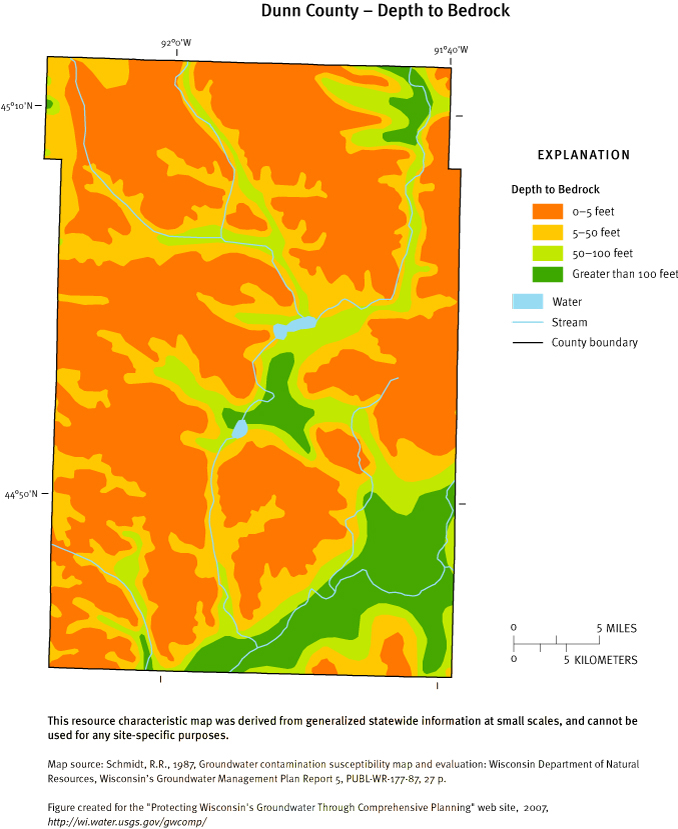
The depth to bedrock indicates the amount of soil and surficial deposits that exist in an area and, therefore how important the type of bedrock is in evaluating pollution potential. Information on the depth to bedrock map is used to determine the relative weight given to the other resource characteristic maps. For example, where the bedrock surface is deep and the water table occurs above the bedrock, the type of bedrock is not considered in determining groundwater contamination susceptibility. Where the depth to bedrock is shallow (less than 50 feet below the land surface), the water table is likely to occur in the bedrock. In that case, the type of bedrock is considered because it could influence a contaminant’s ability to reach the groundwater. This map identifies areas where the depth to bedrock is 0-5 feet (in at least 35% of the area), 5-50 feet, 50-100 feet and greater than 100 feet.
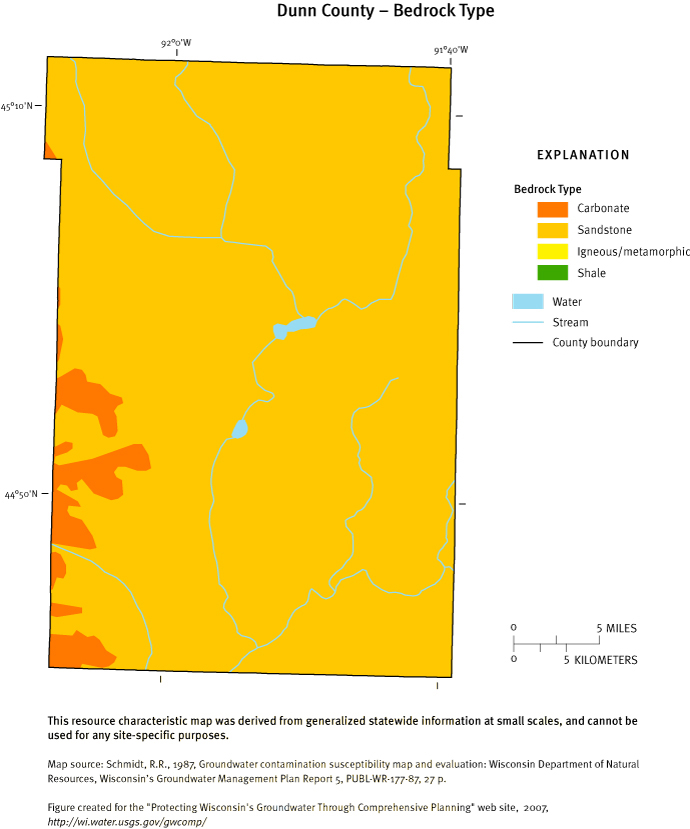
When bedrock is less than 50 feet from the land surface and the water table occurs in the bedrock, the type of bedrock is important in determining how easily a contaminant can reach the groundwater. Bedrock types that allow water to pass quickly through them will offer less protection from contaminants. In Wisconsin, these types of bedrock are typically limestone and dolomite which are highly fractured. Igneous and metamorphic rocks (e.g. granite) and sandstone are less fractured and offer some protection from infiltrating water which may contain contaminants. On the other hand, shale bedrock is almost impermeable, and doesn’t allow water and accompanying contaminants to pass through it as easily. The bedrock categories used for this project are carbonates, sandstone, igneous/metamorphic/volcanic, and shale.
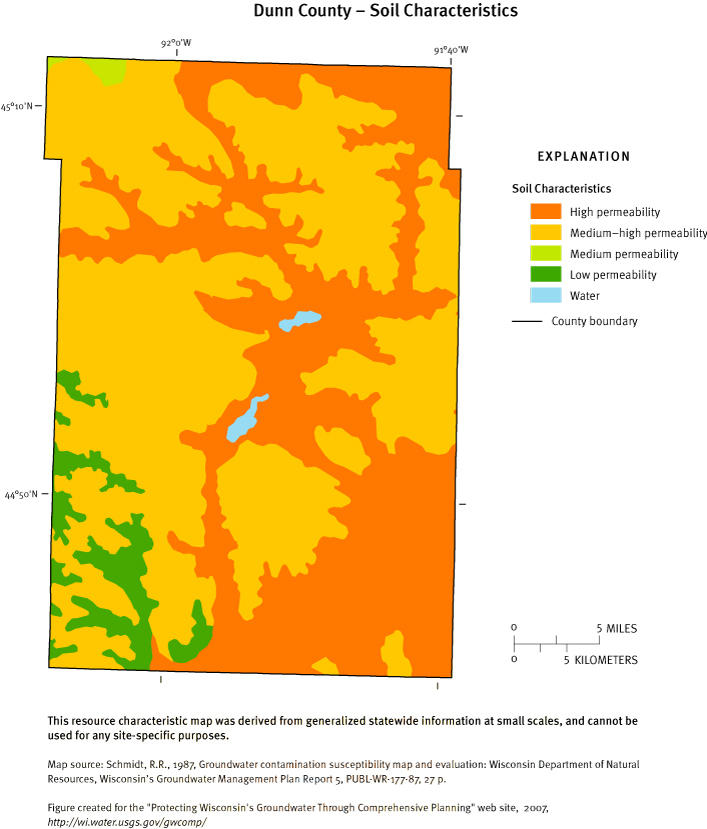
The top layer of materials covering most of the land in Wisconsin is the soil. The soil is defined as the unconsolidated material occurring from the land surface to five feet below the land surface. This is the first material through which water (and accompanying contaminants from the land surface) flow on their way to recharging the groundwater. The soil categories called “associations” have been rated by their ability to restrict the downward movement of water and accompanying pollutants. Important characteristics to consider are soil texture (the amount of sand, silt and clay), organic matter content, permeability and water holding capacity. The soil associations were grouped according to the following characteristics: high susceptibility (highly permeable soils with coarse texture, e.g., sand and gravel); medium/high susceptibility (permeable soils with coarse texture, e.g., sandy soils); medium susceptibility (moderately permeable soils with medium texture, e.g., loamy soils); and low susceptibility (least permeable soils with fine texture, e.g., silty and clayey soils).
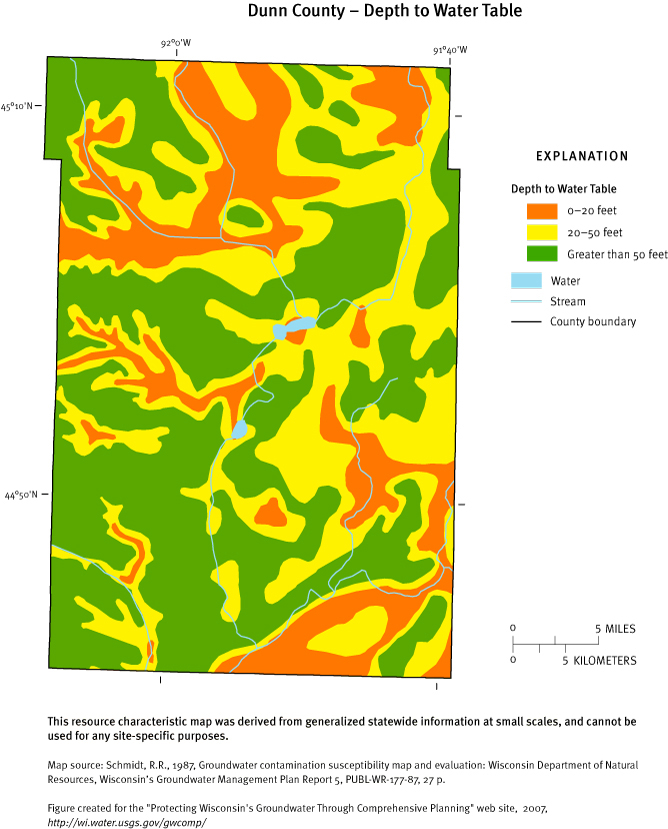
It is important to know where the water table is when trying to determine groundwater contamination susceptibility. The closer the water table is to the land surface, the less contact contaminants have with filtering materials overlying the water table. The depth to water table is difficult to map on a statewide basis because it’s almost as variable as the terrain. The information used in this mapping project identified where the water table was less than 20 feet, between 20 and 50 feet, and greater than 50 feet from the land surface.
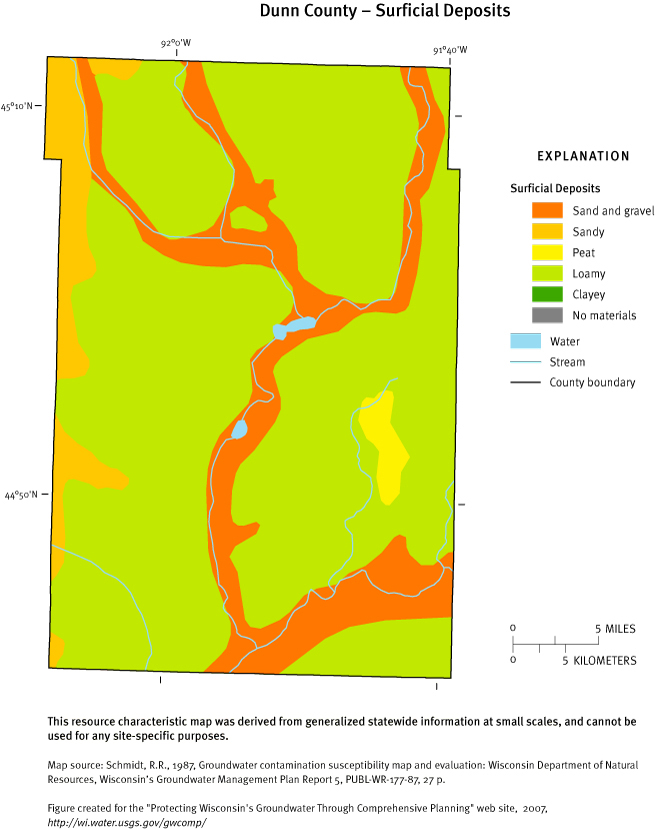
Surficial deposits are unconsolidated materials lying on top of bedrock. Except for the unglaciated southwest portion of the state, most of the surficial deposits in Wisconsin were left by glaciers. These materials differ, depending on how they were deposited. Some glacial materials were deposited by melting waters, and are well sorted or have layers of both fine materials and gravelly materials. Infiltrating waters must pass through these materials en route to the groundwater. Except in areas of shallow bedrock, the surficial deposits are considered the most important factor in determining how susceptible an area is to groundwater contamination. The surficial deposits have been categorized into six groups: sand and gravel; sandy; loamy; peat; and no materials (not shown at this scale). Areas having sand and gravel deposits are considered susceptible to groundwater contamination; and areas with clayey deposits are considered less susceptible.