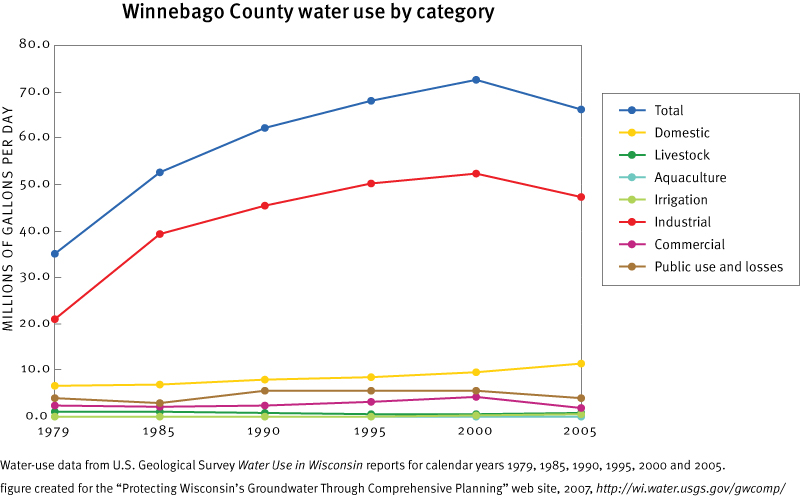
Water-use data were updated in January 2008 to include 2005 data. Some water-use estimates prior to 2005 have been revised since published in the U.S. Geological Survey "Water Use in Wisconsin" summary reports.
Thermoelectric and mining data are not considered in water-use tables or figures on this web site. Thermoelectric-power water use is the amount of water used in the process of generating thermoelectric power. The predominant use of water is as non-contact cooling water to condense the steam created to turn the turbines and generate electricityD1.

(millions of gallons per day) |
||||||
| Surface-water use | ||||||
| Groundwater use | ||||||
| Total water use | ||||||