Abstract
In the 1970’s and 1980’s, researchers discovered high concentrations of mercury in fish from remote settings around the world lacking any obvious mercury source. It is currently (2015) understood that atmospheric deposition is the dominant mercury source to most areas, and that the production of methylmercury is the key process that translates low mercury loading rates into relatively high bioaccumulation/exposure levels. Literally no aquatic ecosystem is protected from this seemingly ubiquitous problem, yet site-specific information on methylmercury concentrations in environmental media (water, sediment and biota) for most locations is not available. Such is the case for many of the areas under the stewardship of the National Park Service (NPS). To fill this information gap, the U.S. Geological Survey (USGS) and NPS have constructed a model that predicts surface water methylmercury concentrations across many NPS parks using available data on water quality (pH, sulfate, total organic carbon) and land cover characteristics (wetland abundance) known to be related to—or directly involved with—the production of methylmercury. A web mapping application has been developed to display the results of this model, and is intended to assist NPS managers in understanding the relative likelihood of problematic methylmercury levels in their location, compared with other park units in the NPS Inventory and Monitoring (I&M) Program.
Background
Mercury (Hg) is a natural element, however human activity has significantly altered its current (2015) distribution in the environment compared to predevelopment times (Mason and others, 1994; Wentz and others, 2014). While man has been utilizing mercury’s unique characteristics dating back to at least the Roman era (when it was used to extract gold from ores), its uses were greatly accelerated in manufacturing and mining during industrialization. Anthropogenic atmospheric mercury emissions have varied substantially in terms of both source and magnitude since the mid-nineteenth century (Streets and others, 2011). Atmospheric deposition serves as the principal mercury source to a large majority of environmental settings, and results in relatively low contamination levels. In some settings, however, land-based mercury sources, such as mining and industrial effluents, can also be important (Wentz and others, 2014).
Unlike most contaminants that are attenuated and/or mitigated by natural processes (for example, the biodegradation of man-made organic compounds), mercury is one of a very few number of contaminants that undergoes a substantial increase in its expressed toxicity once released to the environment. This phenomenon is the result of the methylation process, which results in the production of methylmercury. In aquatic food webs, methylmercury constitutes nearly all the mercury found in apical predators, yet it rarely exceeds 10 percent of the total mass of mercury in sediment or water (Wiener and others, 2003). Toxicological concern for methylmercury is due to two factors: (1) it exhibits extremely high bioaccumulation levels in food webs—commonly 105 to 107 (Wiener and others, 2003); and (2) its biochemistry in most fish, wildlife, and humans leads to targeted accumulation in sensitive organs such as the brain (Scheuhammer and others, 2007).
Despite the risks posed by mercury contamination, mercury data in the environment is relatively scarce. Water samples are highly sensitive to contamination artifacts resulting from improperly prepared sample containers or mishandling by field personnel. Therefore, the acquisition of high-quality mercury data for environmental waters requires sampling by trained personnel using mercury-clean equipment, as well as analysis in a mercury-clean laboratory setting using the highly sensitive analytical methods. These logistic and financial requirements result in relatively high cost of conducting mercury and methylmercury monitoring, and, as a result, data availability for reliable environmental mercury data remain generally unavailable in most locations.
Modeling
In an effort to fill this data gap, the USGS and NPS have constructed a model that predicts surface water methylmercury concentrations based on environmental data that are widely available and known to be related to the methylmercury production. This model uses partial least squares regression techniques to relate aqueous methylmercury concentrations to specific water quality and land cover characteristics from a wide range of environmental conditions and locations. Specifically, the model was calibrated using data from 12 focused studies conducted across the conterminous US, spanning a 13-year period from 1995 through 2008. All data were collected by trained USGS scientists and analyzed in a mercury-clean setting by the USGS Mercury Research Laboratory located in Middleton, Wisconsin. The relevant water quality characteristics were pH, sulfate, and total organic carbon; wetland abundance was the relevant land cover characteristic. Wetland land cover was determined for each calibration site watershed by using a Geographic Information System (GIS) to summarize data from the 2006 National Land Cover Database (NLCD) (Fry and others, 2011). These four characteristics have long been known to be important for determining ecosystem sensitivity to mercury loading and the resulting levels in local food webs (Wiener and others, 2006). It is important to note that the relation between methylmercury in surface water and each of these environmental characteristics is not necessarily positive and linear (Fig. 1). Thus, use of the partial least squares modeling strategy was important, as it has the ability to account for non-linearity and covariance in the prediction data set.
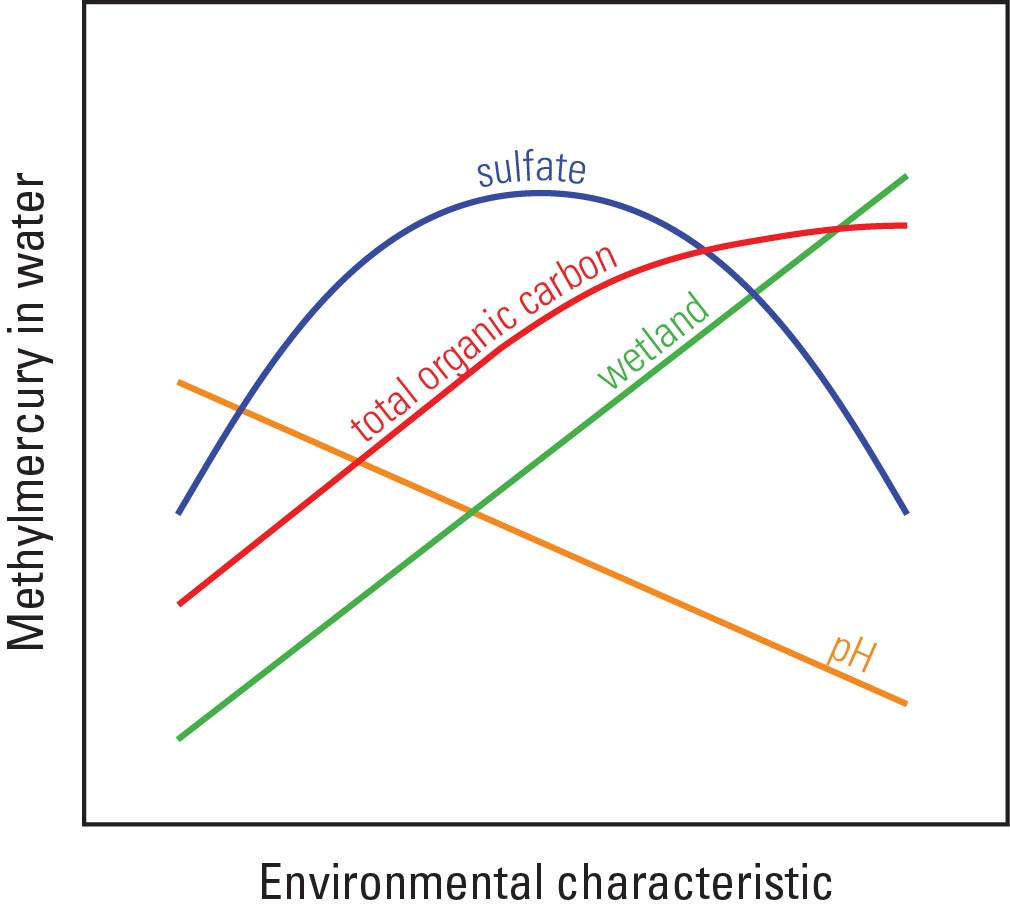
Figure 1. Relation between methylmercury in surface water and the environmental characteristics used as explanatory variables in this model. (Figure modified from Pritz and others, 2014; Figure 3)
Following the development of the model, large datasets of the explanatory variables were assembled from thousands of sites in or near NPS I&M Program park units. Water quality data for pH, sulfate, and total organic carbon were queried and combined from USGS and NPS agency datasets (NWIS and STORET, respectively), and median values were summarized to a modified 8-digit hydrologic unit (HUC) wherever sufficient data existed (Seaber and others, 1987; Watermolen, 2005; NPS Inventory and Monitoring Program, 2009). Wetland land cover data for each HUC was summarized in a GIS using NLCD and Coastal Change Analysis Program (C-CAP) land cover datasets (Guam (Department of Commerce and others, 2009c), Saipan (Department of Commerce and others, 2009b), Tutuila (Department of Commerce and others, 2010b), West Manua (Department of Commerce and others, 2010c), East Manua (Department of Commerce and others, 2010a), Hawaii [Molokai] (Department of Commerce and others, 2009g), Hawaii [Maui] (Department of Commerce and others, 2009a), Hawaii [Hawaii] (Department of Commerce and others, 2010d), conterminous US (Fry and others, 2011), Alaska (Homer and others, 2004), US Virgin Islands [St. Thomas] (Department of Commerce and others, 2009f), US Virgin Islands [St. John] (Department of Commerce and others, 2009e), US Virgin Islands [St. Croix] (Department of Commerce and others, 2009d)). These data summaries were used, together with the model, to generate predicted surface water methylmercury concentrations for each HUC intersecting an I&M Program park unit.
Use of product
This mapping application displays the predicted methylmercury concentrations, as determined by the model, together with the summarized data for the explanatory variables. This product is not intended to be a substitute for obtaining actual methylmercury data to inform management decisions. Instead, it should be viewed as a tool that reports predicted methylmercury concentrations in surface water based on current paradigms describing methylmercury production in environmental systems. Locally important factors such as the existence of possible point sources (for example, upstream abandoned mines) and mercury deposition data were not considered in the generation and application of this model. Proper interpretation of the data results from this model can best be described as the relative potential an area has for methylmercury issues, assuming a consistent source input across the Nation.
Methylmercury in fish
For natural resource management agencies, predicted fish mercury concentrations are more relevant than surface water concentrations, however fish mercury concentrations are notoriously complicated and difficult to predict due to the confounding influence of many biological factors such as species, age, sex and growth rates. That said, methylmercury concentrations in surface water consistently relate well to fish mercury concentrations, even in the few studies that have analyzed this relation across broad geographic areas (Figs. 2-4) (Brumbaugh and others, 2001; Chasar and others, 2009; Scudder and others, 2009). At this time, current (2015) science does not allow for accurate prediction of fish mercury concentrations. However, using the developed model for predicted surface water methylmercury concentrations, resource managers can garner a relativized likelihood that their local ecosystem will have greater or lesser fish mercury levels.


Figure 2. Length-normalized concentration of mercury in (a) all species of fish (excluding NVBR basin) and (b) largemouth bass as a function of methylmercury concentration in water. (Figure and caption modified from Brumbaugh and others, 2001; Figures 5 and 6)
 |
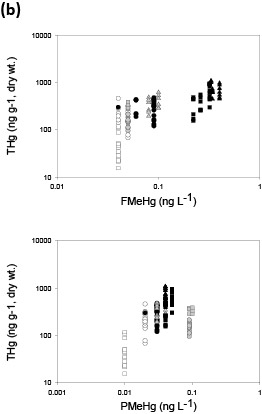 |
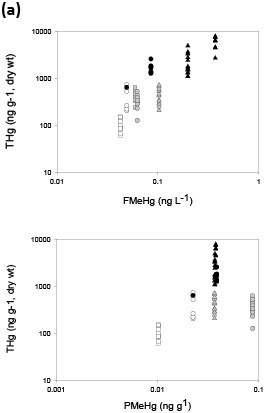
Figure 3. Fish tissue total mercury (THg) concentrations versus stream water filtered methylmercury (FMeHg) and particulate methylmercury (PMeHg) for (a) predator fish and (b) forage fish. Hg in biota is plotted against stream water data averaged over 2-3 years (period of study) for predator fish and 1 year for forage fish, based on average age for each category and general estimates of tissue turnover. Colors represent streams in Oregon (white), Wisconsin (gray), and Florida (black). Shapes represent nonurban streams: triangle (Pike River, St Marys River), circle (Lookout Creek, Evergreen Creek, Santa Fe River); and urban streams: square (Beaverton Creek, Oak Creek, Little Wekiva). (Figure and caption modified from Chasar and others, 2009; Figure S3, A-B)
Figure 4. Correlations between length-normalized mercury concentrations in fish and selected environmental characteristics, 1998–2005. [Data for all sites shown, unmined and mined; however, Spearman rank correlation coefficients (rs) are for unmined sites only.] (Figure and caption from Scudder and others, 2009; Figure 21, M-O)
Next steps
In addition to providing park managers with an idea of the relative risk of having methylmercury issues, this web mapping application is also intended to assist park managers in identifying data gaps that exist in their parks. When viewing different layers or when selecting data for a given HUC, data gaps are made apparent either by a lack of color fill or by a lack of returned data value, respectively.
References
Brumbaugh, W.G., Krabbenhoft, D.P., Helsel, D.R., Wiener, J.G., and Echols, K.R., 2001, A National Pilot Study of Mercury Contamination of Aquatic Ecosystems Along Multiple Gradients: Bioaccumulation in Fish: U.S. Fish and Wildlife Service Federal Government Series 2001-0009.
Chasar, L.C., Scudder, B.C., Stewart, A.R., Bell, A.H., and Aiken, G.R., 2009, Mercury Cycling in Stream Ecosystems. 3. Trophic Dynamics and Methylmercury Bioaccumulation: Environmental Science & Technology, v. 43, no. 8, p. 2733–2739.
Department of Commerce, National Oceanic and Atmospheric Administration, National Ocean Service, and Coastal Services Center, 2009a, 2001 Hawaii Land Cover, Maui and Kahoolawe Islands.
Department of Commerce, National Oceanic and Atmospheric Administration, National Ocean Service, and Coastal Services Center, 2010a, 2003 C-CAP Land Cover, Territory of American Samoa, East Manua.
Department of Commerce, National Oceanic and Atmospheric Administration, National Ocean Service, and Coastal Services Center, 2010b, 2003 C-CAP Land Cover, Territory of American Samoa, Tutuila.
Department of Commerce, National Oceanic and Atmospheric Administration, National Ocean Service, and Coastal Services Center, 2010c, 2004 C-CAP Land Cover, Territory of American Samoa, West Manua.
Department of Commerce, National Oceanic and Atmospheric Administration, National Ocean Service, and Coastal Services Center, 2009b, C-CAP Land Cover, Commonwealth of the Northern Mariana Islands (CNMI), Saipan 2005.
Department of Commerce, National Oceanic and Atmospheric Administration, National Ocean Service, and Coastal Services Center, 2009c, C-CAP Land Cover, Territory of Guam 2005.
Department of Commerce, National Oceanic and Atmospheric Administration, National Ocean Service, and Coastal Services Center, 2009d, C-CAP Land Cover, United States Virgin Islands, St Croix, 2002.
Department of Commerce, National Oceanic and Atmospheric Administration, National Ocean Service, and Coastal Services Center, 2009e, C-CAP Land Cover, United States Virgin Islands, St John 2005.
Department of Commerce, National Oceanic and Atmospheric Administration, National Ocean Service, and Coastal Services Center, 2009f, C-CAP Land Cover, United States Virgin Islands, St Thomas, 2003.
Department of Commerce, National Oceanic and Atmospheric Administration, National Ocean Service, and Coastal Services Center, 2010d, C-CAP US (United States) Pacific Islands Big Island, Hawaii 2001-Era Land Cover Project.
Department of Commerce, National Oceanic and Atmospheric Administration, National Ocean Service, and Coastal Services Center, 2009g, Hawaii Land Cover, Molokai Island.
Fry, J., Xian, G., Jin, S., Dewitz, J., Homer, C., Yang, L., Barnes, C., Herold, N., and Wickham, J., 2011, Completion of the 2006 National Land Cover Database for the Conterminous United States: Photogrammetric Engineering & Remote Sensing, v. 77, no. 9, p. 858–864.
Homer, C., Huang, C., Yang, L., Wylie, B., and Coan, M., 2004, Development of a 2001 national landcover database for the United States: Photogrammetric Engineering and Remote Sensing, v. 70, no. 7, p. 829–840.
Mason, R.P., Fitzgerald, W.F., and Morel, F.M., 1994, The biogeochemical cycling of elemental mercury: anthropogenic influences: Geochimica et Cosmochimica Acta, v. 58, no. 15, p. 3191–3198.
NPS Inventory and Monitoring Program, 2009, NPS Vital Signs Monitoring Networks - medium resolution coastline.
Pritz, C.F., Eagles-Smith, C., and Krabbenhoft, D., 2014, Mercury in the national parks: The George Wright Forum, v. 31, no. 2, p. 168–180.
Scheuhammer, A.M., Meyer, M.W., Sandheinrich, M.B., and Murray, M.W., 2007, Effects of Environmental Methylmercury on the Health of Wild Birds, Mammals, and Fish: AMBIO: A Journal of the Human Environment, v. 36, no. 1, p. 12–19.
Scudder, B.C., Chasar, L.C., Wentz, D.A., Bauch, N.J., Brigham, M.E., Moran, P.W., and Krabbenhoft, D.P., 2009, Mercury in Fish, Bed Sediment, and Water from Streams Across the United States, 1998–2005: U. S. Geological Survey
Scientific Investigations Report 2009-5109, p. 74.
Seaber, P.R., Kapinos, F.P., and Knapp, G.L., 1987, Hydrologic unit maps: United States Geological Survey WSP - 2294.
Streets, D.G., Devane, M.K., Lu, Z., Bond, T.C., Sunderland, E.M., and Jacob, D.J., 2011, All-Time Releases of Mercury to the Atmosphere from Human Activities: Environmental Science & Technology, v. 45, no. 24, p. 10485–10491.
Watermolen, J., 2005, 1:2,000,000-Scale Hydrologic Unit Boundaries.
Wentz, D.A., Brigham, M.E., Chasar, L.C., Lutz, M.A., and Krabbenhoft, D.P., 2014, Mercury in the Nation’s Streams—Levels, Trends, and Implications: U. S. Geological Survey Circular 1395, p. 90.
Wiener, J.G., Knights, B.C., Sandheinrich, M.B., Jeremiason, J.D., Brigham, M.E., Engstrom, D.R., Woodruff, L.G., Cannon, W.F., and Balogh, S.J., 2006, Mercury in Soils, Lakes, and Fish in Voyageurs National Park (Minnesota): Importance of
Atmospheric Deposition and Ecosystem Factors: Environmental Science & Technology, v. 40, no. 20, p. 6261–6268.
Wiener, J.G., Krabbenhoft, D.P., Heinz, G.H., and Scheuhammer, A.M., 2003, Ecotoxicology of mercury, in Handbook of ecotoxicology, CRC Press, Boca Faton, FL, p. 409–463.
|