 SOURCES
OF WATER TO DEEP WELLS IN SOUTHEASTERN WISCONSIN SOURCES
OF WATER TO DEEP WELLS IN SOUTHEASTERN WISCONSIN
The ground-water flow model for southeastern Wisconsin
was designed to be a tool that quantifies the changing sources of water to wells
over time. The most interesting results are for recent conditions, corresponding
to year 2000. Here is how the model accounts for the ground water currently discharging
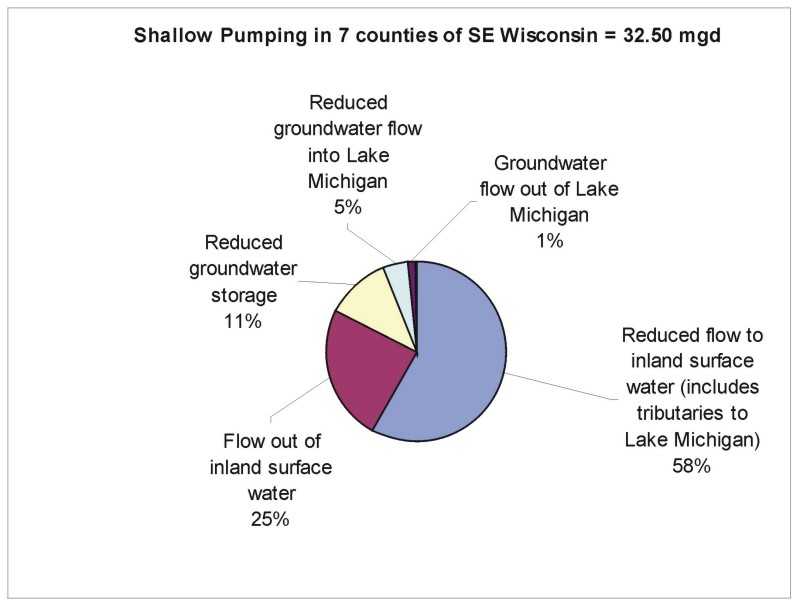
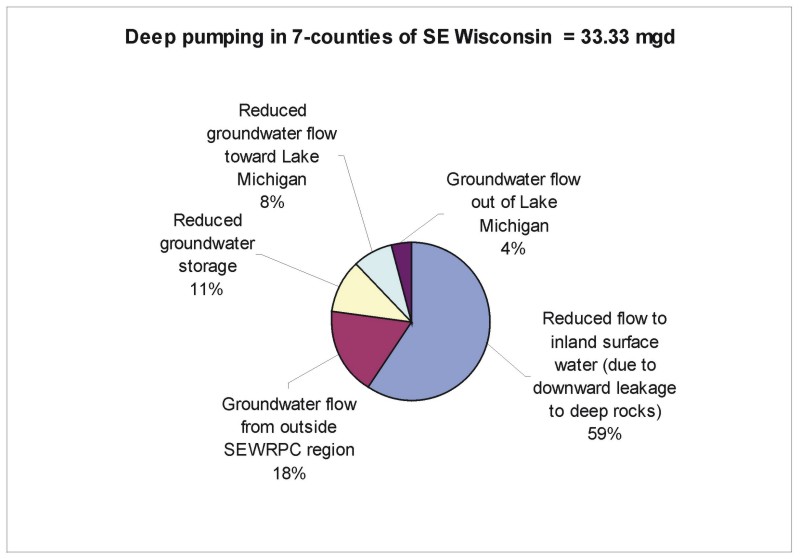
to shallow and deep wells within southeastern Wisconsin:
Water transferred from surface water within the 7 counties of southeastern Wisconsin (the SEWRPC region) accounts for 80% of combined shallow and deep pumping.
Most of this water is ground water captured by wells that would otherwise
discharge to inland surface water bodies (accounting for 59% of total combined
pumping), while another part is water induced by wells into the ground-water
system directly from streams and lakes into the ground-water system (12%). Some
originates as water that in the absence of wells would discharge directly to
Lake Michigan or to the rocks below it (7%) while a small part is drawn directly
from the Lake (about 2%). Most of this last component is flowing downward from
the Lake toward the deep part of the flow system.
The sources of water for shallow and deep wells are release of ground water
from storage below the seven-county region and below Lake Michigan (11%) and
ground-water flow into the region (9%). Flow into the region is mostly from the
west.
The distribution of sources for shallow and deep pumping is different:
One qualification - some of the water transferred
from inland surface-water bodies to wells is ground water that under natural
conditions would discharge to streams that become part of the river flow that
empties into Lake Michigan. This reduction of "indirect" discharge must also
be counted as a loss to the Lake.
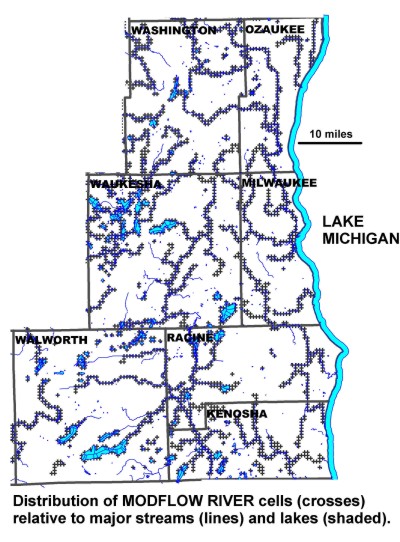
DIVERSION OF SURFACE WATER - due to pumping
Major and secondary surface-water bodies are both important as sources of
water to wells in the seven counties that make up southeastern Wisconsin:
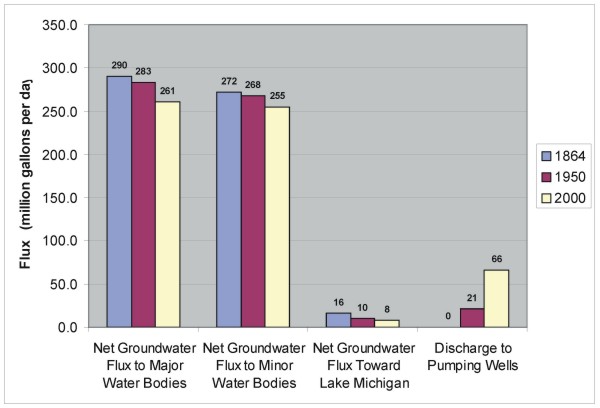
Focusing just on the relation between pumping discharge
and discharge to surface-water bodies (major, minor, Lake Michigan), we can graph
the changes from 1864 to 1950 to 2000:
DEEP WATER BALANCE - changes due to pumping
In order to understand how source water is routed to deep wells pumping from
the sandstone aquifer, it is useful to map the fluxes in and out of the deep
part of the flow system. A flux is the volume of water that passes across a boundary
in a given amount of time. We use flux units of millions of gallons per day.
Before pumping began, the important fluxes included:
1 - Lateral flow across the boundaries for the deep sandstone
aquifer below the seven-county southeastern Wisconsin area - in or out
2 - Vertical
transfer of water between the shallow and deep parts of the flow system - up
or down
Here is a map of the fluxes across the seven-county area that are simulated
by the model for 1864 under natural predevelopment conditions:
 |
Model output: Map of predevelopment fluxes
in millions of gallons per day to/from deep part of flow system below 7 counties
of southeastern Wisconsin
(source: Wisconsin Geological and Natural History Survey
Open-File Report 2004-01) |
nb: The fluxes corresponding to lateral flow
occur across vertical sections that penetrates the thickness of the deep part
of the flow system. In particular, the lateral flow across the eastern boundary
passes through a vertical section through the deep part of the system that follows
the curve of the Lake Michigan coastline for Ozaukee, Milwaukee , Racine and
Kenosha Counties .
nb: The net vertical transfer over the southeastern
Wisconsin area taken as whole is downward, that is it leaks from the shallow
to the deep part of the flow system. The Maquoketa shale inhibits leakage. For
this reason the leakage flux is calculated separately for two areas: where the
shale is present and where it is absent. |
It is worth remarking that the downward leakage amounted to about 1 million
gallon per day over the large area of southeastern Wisconsin where the Maquoketa
is present, but amounted to about 4 million gallons per day in the smaller area
where it is absent. Also, flux moved out of the deep sandstone aquifer toward
the deep rocks below Lake Michigan at a rate of about 3 million gallons per day.
With pumping, two more fluxes appear:
- Water removed by pumping from deep part of flow system
- Water removed from resident water within deep part of flow system - that is, water removed from "storage"
Here is a map of the fluxes simulated for 2000 conditions after 136 years of
pumping:
Comparing the two figures, it is evident that:
Downward leakage from shallow to deep rocks has responded to pumping by increasing
from about 1 to 9 million gallons per day where the Maquoketa is present and
from about 4 to 16 million gallons per day where it is absent. This increase
is at the expense of ground-water discharge to surface-water bodies that are
connected to the shallow part of the flow system.
The change in the deep flow pattern relative to the Lake Michigan coastline
is also dramatic. Where before about 2.8 million gallons per day moved to the
east, by 2000 about 3.7 million gallons per day move to the west from beneath
the Lake toward inland pumping centers. Most of the water moving from beneath
Lake Michigan originates as storage release from the deep rocks below Lake Michigan.
It is also interesting to note that despite the increase in pumping, ground water
continues under current conditions to leave the deep part of the flow system
by lateral flow across its southern boundary. This outward flux is caused by
pumping in northeastern Illinois.
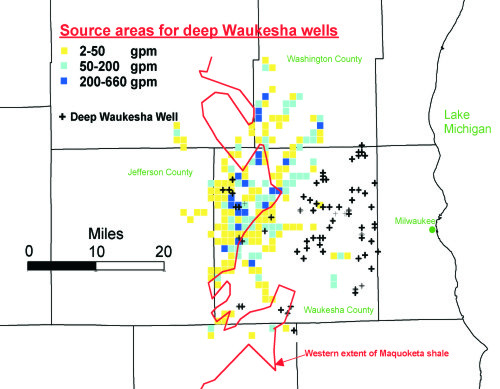
Source areas to deep Waukesha wells
The pumping centers withdrawing the most ground water in southeastern Wisconsin
are in Waukesha County. Most of these wells are located below the Maquoketa shale
in the eastern part of the county. In the western part where the Maquoketa is
missing, it is easier for ground water to circulate from the water table to the
deep sandstone aquifer. More water is also available because recharge tends to
be higher in the western part of the county. The presence of long north-south
trending bedrock valleys, where the upper bedrock is eroded and loose sediment
is in closer proximity to the deep sandstone aquifer, also facilitates downward
leakage. This combination of factors has made for a long-distance relation between
the location of many municipal wells in the eastern part of the county and the
sources of water to these wells in the western part. The east-west travel paths
are typically on the order of 10 miles. The source areas that provide the most
water are not necessarily closest to the wells, but instead are associated with
high recharge areas near Jefferson County and bedrock valleys that extend north
into Washington County.
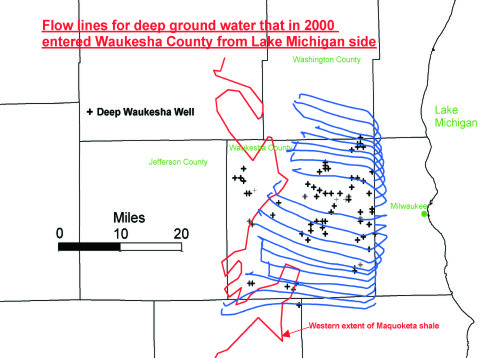
None of the source areas for deep Waukesha wells are
located east of the County. This finding presents a paradox because the model
shows that for 2000 conditions about one-fifth of the water flowing toward deep
wells in Waukesha County enters from the east (on the order of 4.7 million gallons
per day). If such a large amount of ground water is entering from the east, why
aren't their source areas for the wells associated with Lake Michigan? The answer
is that the flow directions converging on pumping centers are very recent relative
to the times of travel from the source areas to the wells. The water that is
now flowing east into Waukesha County originated far to the west, flowed toward
Lake Michigan under the natural gradients that existed before pumping began,
and ultimately reached locations east of Waukesha County. Only in the last 100
years did these flow lines reverse direction and curl back across the Waukesha
County boundary toward the deep wells in the easternmost part of the County:
In this sense Lake Michigan and the rocks below it are not sources of water
for Waukesha wells. The water discharging to the wells all originated as recharge
to the water table within Waukesha and surrounding counties. Only in the (distant)
future will the deep flow lines that enter Waukesha County from the east actually
represent recharge, storage release or induced Lake water originating east of
the County. It is true that less water is flowing under and into Lake Michigan
than before, but it is important to keep in mind that Lake Michigan water is
not actually being pumped from deep wells in southeastern Wisconsin.
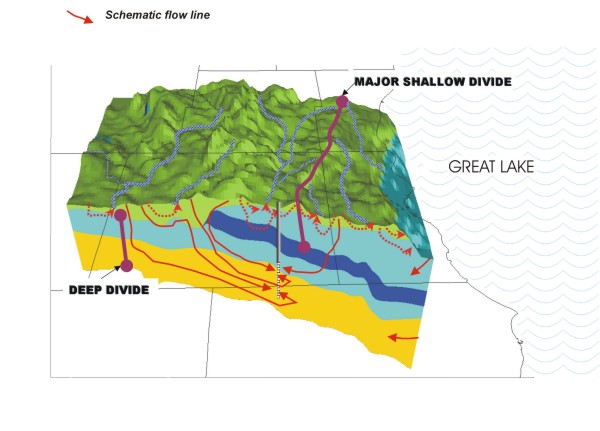
Schematically, the current flow regime can be represented like this:
DOWNWARD LEAKAGE FROM SHALLOW TO DEEP ROCKS - changes due
to pumping
Another way to look at the source of water to wells is to consider the spatial
pattern of downward leakage from the shallow part of the flow system to the deep
sandstone aquifer.
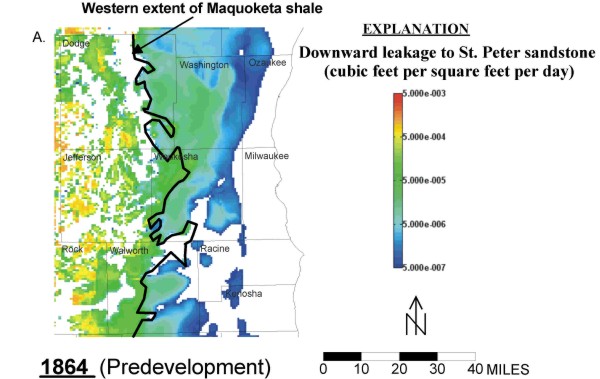
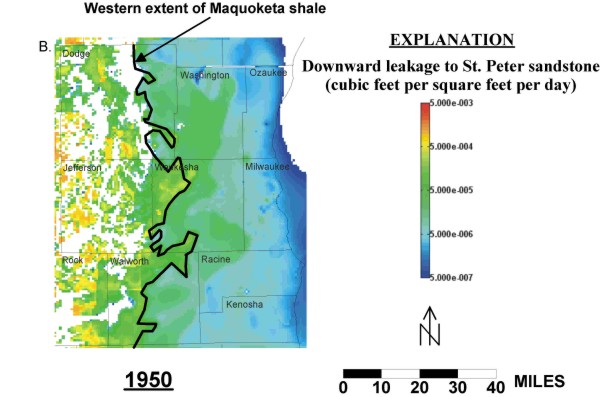
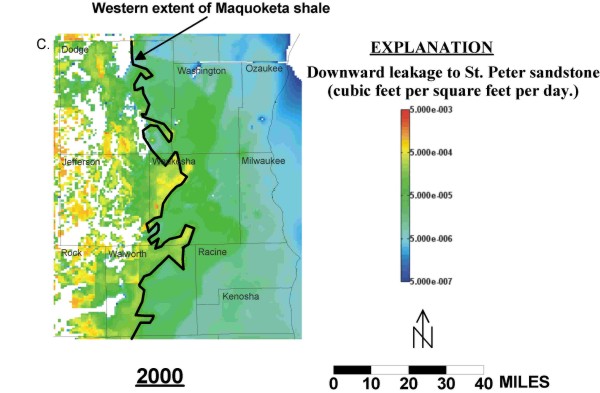
Color-coded maps show the changes through time for southeastern Wisconsin,
where:
- white indicates no downward leakage or transfer
upward from the deep to shallow parts of the system
- blue and green indicate relatively low rates of
downward leakage
- yellow and red indicate relatively high rates of
downward leakage:
|
|
|
|
(source: Wisconsin Geological and Natural
History Survey Open-File Report 2004-01)
|
Under predevelopment conditions, ground water moved upward from the deep sandstone
aquifer toward the lake over a large area. By 1950 the flow was everywhere downward.
The flux of downward leakage is greatest where the Maquoketa shale is absent,
such as in western Waukesha County and northern Walworth Counties. There is low
rate of downward leakage from shallow to deep rocks at the Lake Michigan coastline.
This next graphic summarizes the change in the leakage pattern over the seven-county
SEWRPC area. Notice the extent of the Maquoketa shale (dark-blue layer):
STORAGE RELEASE - due to pumping
Diversion of shallow ground-water flow from surface water bodies is the most
important source of water for pumping from shallow and deep wells. Most of this
diversion takes place locally, but some occurs outside southeastern Wisconsin
and moves laterally into the area across the boundaries of the seven-county area.
Besides diversion of water from surface discharge, there is a second source of
water to wells - that is, release from storage due to the draining of pores in
unconfined aquifers and due to the compression of the aquifer and expansion of
the water in confined aquifers. The rate of storage release is very important
in the vicinity of wells when they first start to pump, but generally diminishes
in importance over time relative to captured surface discharge.
According to the model results, how much water have shallow
and deep wells removed from storage below southeastern Wisconsin?
After 136 years of pumping (1864-2000), the following VOLUMES have been pumped from
below the 7 counties in southeastern Wisconsin in BILLIONS OF GALLONS:
Entire System |
Shallow Part |
Deep Part |
916.1 |
304.3 |
611.8 |
Of this volume, the following amounts have been derived from ground water
already stored in the rocks:
Entire System |
Shallow Part |
Deep Part |
124.4
|
59.0 |
65.4 |
Comparing the total pumped to the amount drawn from storage, it is evident
that other sources of water must exist besides the water that was already in
the rocks below southeastern Wisconsin in 1864. In fact most of water over the
last 136 years was not derived from storage, but instead from captured baseflow
- that is ground water that under natural conditions would discharge to streams
and lakes, including Lake Michigan, but instead is diverted to pumping wells.
Another, smaller part was derived from storage in a different place - in the
deep rocks under Lake Michigan. However, even if pumping has removed a relatively
small amount of the total discharge from storage, the amount released between
1864 and 2000 has, in total, been very large. One way to show this is to suppose
pumping had ceased completely and instantaneously in 2000, allowing water levels
to recover.
How long would it take during recovery to replace 50% of the water drawn out
of storage under the seven-county region?
Shallow Part |
Deep Part |
13 years |
9 years |
How long would it take during recovery to replace 90% of the water withdrawn
from storage?
Shallow Part |
Deep Part |
100 years |
70 years |
return to top |