 OVERVIEW OF GROUND-WATER FLOW SYSTEM IN SOUTHEASTERN WISCONSIN OVERVIEW OF GROUND-WATER FLOW SYSTEM IN SOUTHEASTERN WISCONSIN
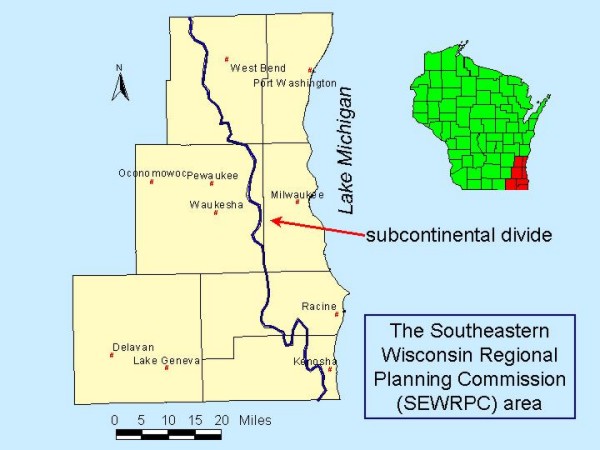
The setting for the case study is a seven-county region that constitute southeastern
Wisconsin, also known as the SEWRPC (Southeastern Wisconsin Regional Planning
Commission) area. Four of the counties border Lake Michigan:
The subcontinental divide that crosses the study area is the watershed boundary
for the Great Lakes Basin. West of this divide, rivers and the waters that replenish
them do not discharge to the Great Lakes but, instead, are tributary to the Mississippi
River. The subcontinental divide is very close to Lake Michigan in southeastern
Wisconsin. The map shows that more than half the case study area lies west of
the divide and, therefore, falls in the Mississippi River Basin.
Studies indicate that the aquifers below southeastern
Wisconsin are the source of potable water for 700,000 persons, or about 37% of
the resident population in the seven counties. The remaining 63% of the population
is provided with public water supply drawn from Lake Michigan. A good source
for information on the role of ground water in the water supply for southeastern
Wisconsin is a publication issued by the Southeastern Wisconsin Regional Planning
Commission and by the Wisconsin Geologic and Natural History Survey called "Groundwater
Resources of Southeastern Wisconsin", SEWRPC Technical Report No. 37,
June 2002.
The area of greatest ground-water use is around the growing city of Waukesha.
Because Waukesha is west of the subcontinental divide, there are legal constraints
on its ability to draw on Lake Michigan water that have, so far, obliged the
city and its surrounding area to rely almost entirely on ground water. Increasing
drawdown at all deep wells and radium concentrations above Federal standards
at some deep wells have prompted the city to investigate alternative sources
of drinking water, including shallow wells, distant deep wells, and lake water
transferred by pipeline. Such efforts have intensified interest in expanding
our knowledge of the regional ground-water system and its connection to surface
water.
A large part of any improved understanding of the regional ground-water system
depends on developing a quantitative tool to study how ground water interacts
with the huge body of water that sits off the Wisconsin coast - Lake Michigan.
Between 2000 and 2003, a team of hydrogeologists from several state and federal
agencies in Wisconsin cooperated to develop such a tool in the form of three-dimensional
ground-water flow model capable of not only describing the system at a given
time, but also accounting for historical changes.
The basis of the model is the representation of
the physical geology in the subsurface. The geology and its influence on ground-water
flow (that is, the "hydrogeology")
are not changed by human activity. In contrast, the network of wells that grew
over the course of the 20th century has had a profound effect on the ground-water
flow system.
We will look briefly at these key elements of the model.
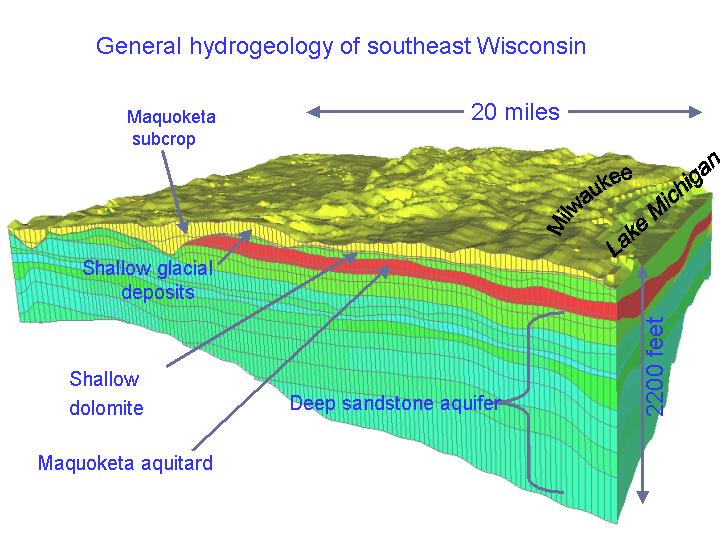
Hydrologic Framework in Southeast Wisconsin
- There are three principal groups of rocks, each containing
aquifers:
- Shallow unlithified material containing sand and gravel aquifers (Shallow
part of flow system)
- Shallow bedrock containing the fractured dolomite aquifer (Shallow part of
flow system)
- Deep part of the flow system containing the sandstone
aquifer
- Along Lake Michigan, the shallow and deep parts of the
flow system are separated by the Maquoketa shale, an aquitard that keeps the
deep sandstone under pressure.
- Most municipal pumping in population centers near Lake Michigan is from the
deep bedrock.
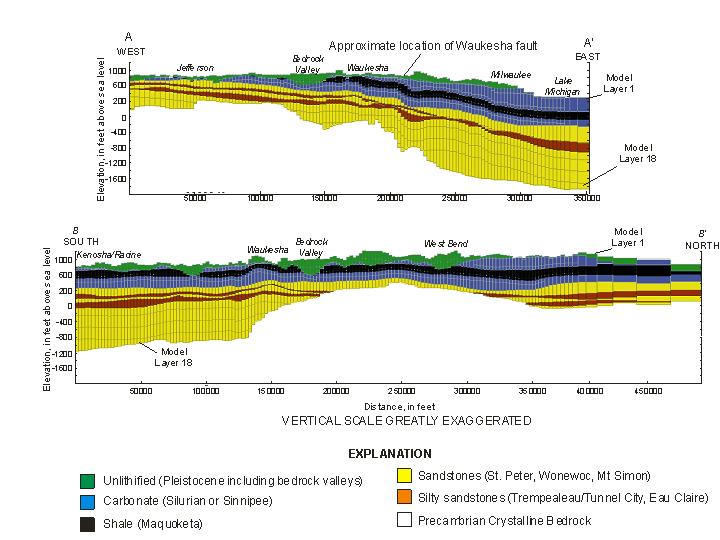
The hydrogeologic units shown in the west-to-east cross section dip to the
east and thicken under Lake Michigan.
It is worth stressing that close to Lake Michigan the shallow part of the
flow system consists of two formations - the unlithified glacial tills and outwash
with alluvial deposits overlying fractured Silurian dolomite. The deep part of
the flow system is capped by the Sinnipee dolomite and St. Peter sandstone. The
two parts are hydraulically separated by the resistive Maquoketa shale. Farther
west where the shale is absent, the shallow part of the flow system consists
only of unlithified deposits, while the dolomite and sandstone at the top of
the deep part of the system are closer to the land surface and in better connection
with shallow, local flow systems.
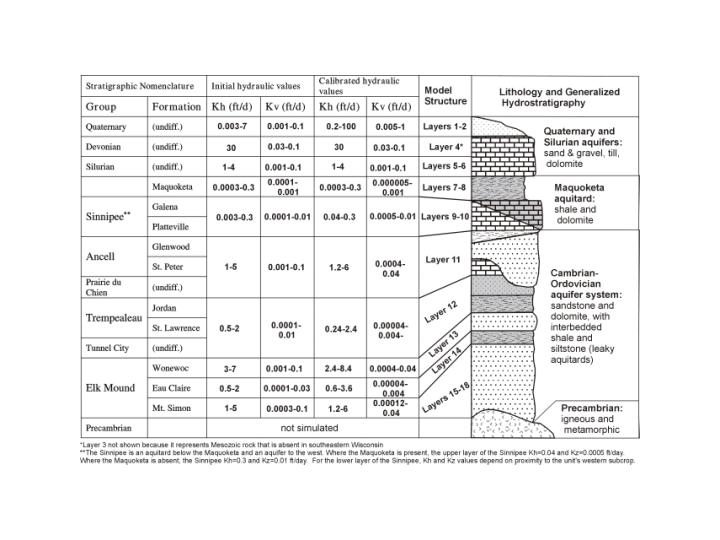
A stratigraphic column provides a detailed look at the units considered by
the model, from the oldest rocks (the Mt. Simon Formation at the bottom of the
deep sandstone aquifer) to the youngest (Quaternary deposits, i.e., glacial and
alluvial deposits). The column also provides the range of hydraulic conductivity
values used in the model to describe the ease of flow through each unit.
The hydrostratigraphy for Southeastern Wisconsin is also represented along
different slices in a VIDEO CLIP (1189 kb).
The viewer is looking northeast from the Illinois/Wisconsin boundary. The slices
are aligned with the southeast dip of the bedrock units. Yellow rocks are sandstone
units, light green are silty sandstone, light blue and dark blue are dolomite,
red is Maquoketa shale, and dark green is unlithified material (glacial tills
and outwash, river deposits).
The model consists of 18 layers which constitute all or part of an individual
rock unit. The shallow system above the Maquoketa shale is represented by 6 layers.
The shale itself and an underlying carbonate unit are represented by 4 layers.
The units that constitute the deep sandstone aquifer are divided into 8 model
layers.
Each model layer is assigned parameter zones that account for the properties
of the rock that affect ground-water flow, One important property is hydraulic
conductivity. The following figure gives an example of the horizontal and vertical
hydraulic conductivity distribution in a clean, permeable sandstone, called the
Wonewoc Formation. It lies in the middle of the deep sandstone aquifer:
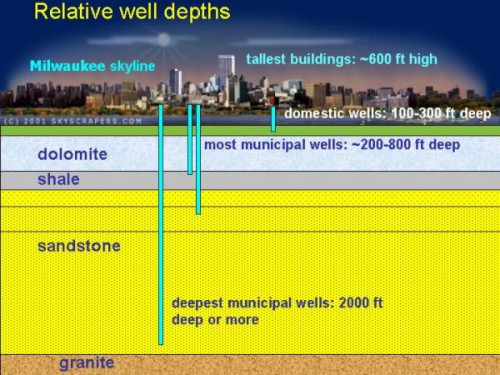
Shallow and deep wells penetrate the various rock units
to various depths:
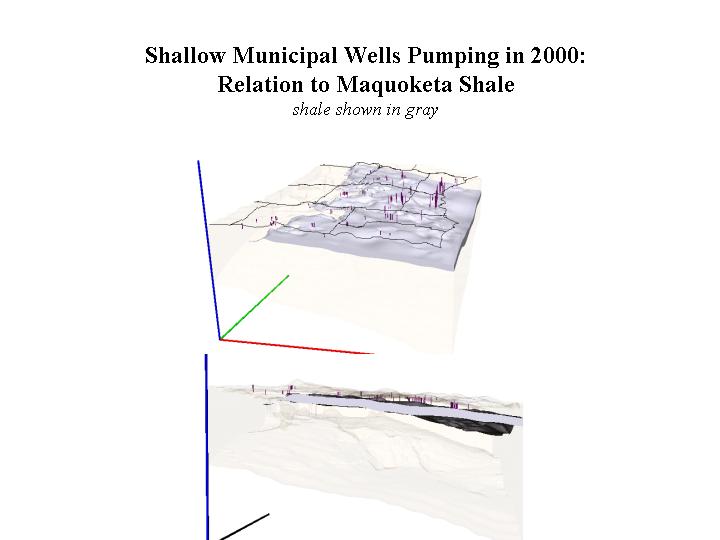
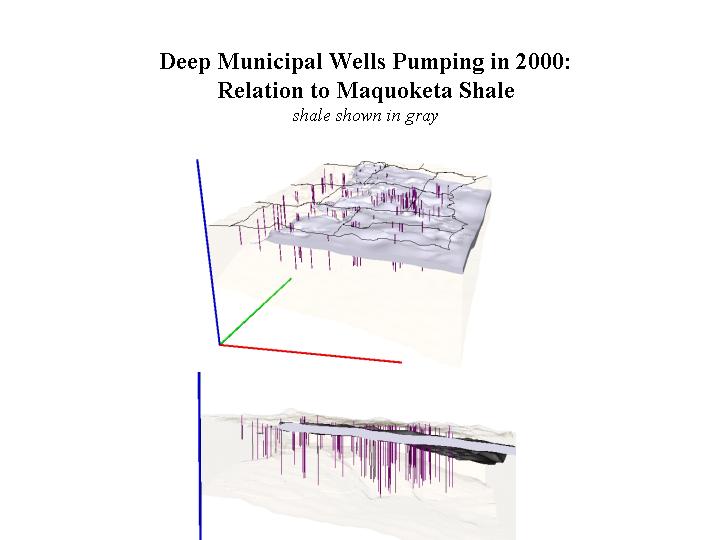
To provide a picture of where the big "high-capacity" wells
are located that in 2000 supplied most of the ground water to municipalities
and industries, the next set of figures show three-dimensional views of the shallow
and deep network. Shallow wells pump from unlithified deposits and the Silurian
dolomite (where present above the shale), deep wells pump from Sinnipee dolomite
and (mostly) from deep sandstone:
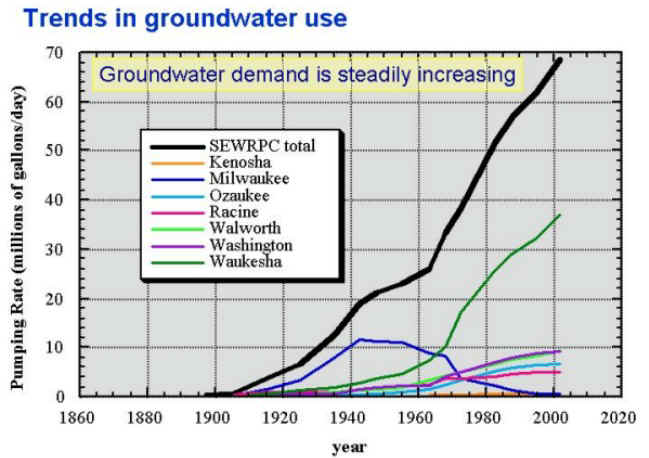
The network of high-capacity wells for southeastern Wisconsin grew up gradually
over time between the late 19th century and the present. The growth of the network
is reflected in the total ground-water demand for the SEWRPC counties and three
bordering western counties:
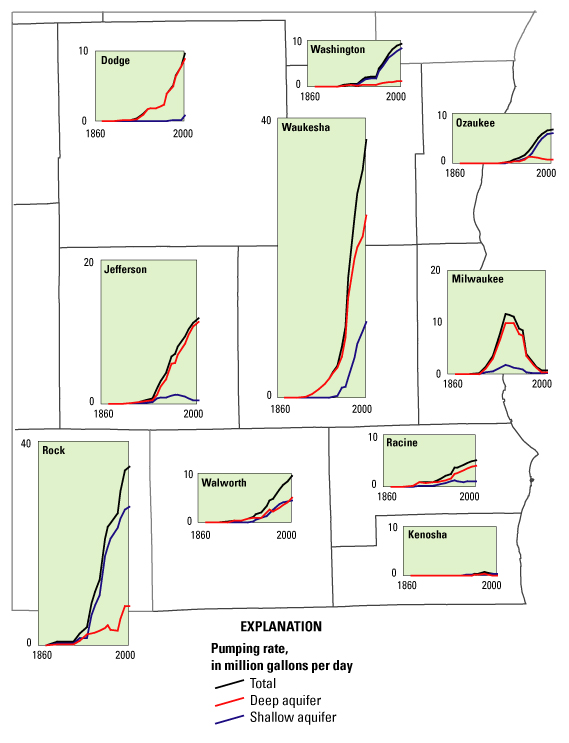
A closer look at the well-use data show the separate trends for shallow and
deep wells:
The pumping history varies by county. Municipal and industrial pumping has
decreased in some counties that have shifted from ground water to Lake Michigan
water (for example, Milwaukee County), but has increased in other counties farther
from the Lake that have growing populations (for example, Waukesha County). Some
counties rely heavily on shallow wells in sandy deposits (for example, Rock County)
or fractured shallow dolomite (for example, Ozaukee County) while withdrawals
in others are focused in the deep sandstone units (for example, Jefferson County).
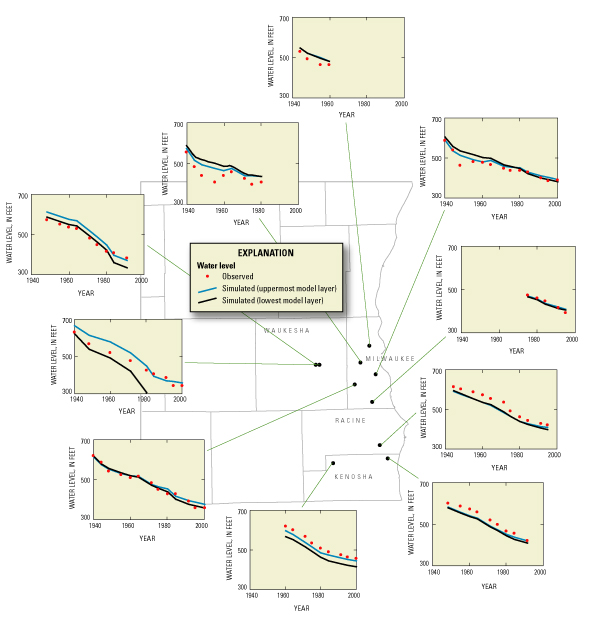
The spread of the well network and the increase in withdrawal rates has caused
a regional drawdown cone to develop in southeastern Wisconsin. The rate of drawdown
is greatest in the confined portions of the deep sandstone aquifer overlain by
the Maquoketa shale. Individual deep wells currently average 7 feet a year of
additional drawdown in much of the area:
The graphs show not only the observed drawdown at wells,
but also the match achieved by the ground-water model to the observed drawdown.
The model simulates the historical response of the ground-water system to pumping
that is reflected at the observation wells. The generally good agreement between
measured and simulated trends is evidence that the model properly captures the
historical behavior of the regional flow system.
return to top |


