 EFFECTS
OF PUMPING ON SHALLOW & DEEP WATER LEVELS - DRAWDOWN EFFECTS
OF PUMPING ON SHALLOW & DEEP WATER LEVELS - DRAWDOWN
Ground-Water Levels
Ground-water levels are dynamic, changing in response to additions and losess to the system. For example, ground-water levels change in response to pumping. To
understand
how they change, it is first necessary to understand how they behave under
natural
non-pumping conditions.
The surface that corresponds to the elevation of the top of the ground-water
system is
called the water table; it represents the top of the unconfined part of the flow
system.
This surface can be mapped by plotting the water levels in shallow wells that
are open to
the interval where the ground becomes fully saturated. It is also possible to
map other
surfaces - for example, the surface that corresponds to water levels in wells
that are open
to a specific formation or horizon deeper in the ground-water system. This
deeper surface
is called a potentiometric surface and often is chosen to correspond to a
confined aquifer.
At the water table, ground water
flows mostly horizontally from the high areas of the
surface to the low areas following the shallow "hydraulic gradient" (an
energy gradient
that responds to the height of the water and the water pressure).
The same is true
deeper in the system - water flows mostly horizontally from
the high areas of the
potentiometric surface to the low areas. However, it is also
possible for ground water to
flow at an appreciable angle to the horizontal, trending vertically
from a higher (or lower) point in one
water-level surface to a lower (or higher) point in another
water-level surface.
For example, if at a particular location the water-table elevation is at a
higher elevation
than the potentiometric surface for an underlying layer, then ground water will
tend to flow
downward along the vertical hydraulic gradient at that point. Elsewhere, the
water table
elevation might be lower than the deeper potentiometric surface and ground water
will flow upward. This last condition is common in valleys or coastlines where
rivers
or lakes act as ground-water discharge areas for a region. The amount of
vertical
flow is controlled by the difference in the shallow and deep water level and the
resistance
posed by the intervening rock.
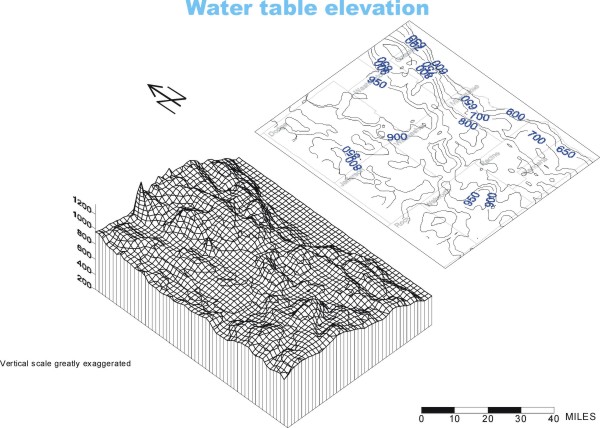
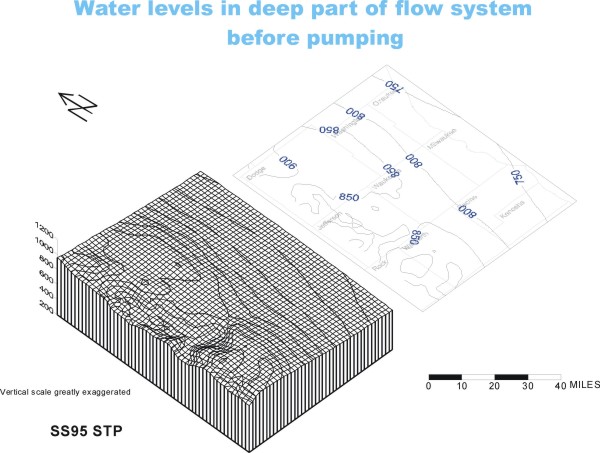
The next two figures show example
surfaces corresponding to, first, the water table in an unconfined system and,
second, the potentiometric surface in a deep aquifer. They
are each represented in two ways: as 3D "hills and valleys" and as
2D contour lines. Flow is
northeastward toward a large lake. The numbers on the contour
lines are not important,
but if you look closely you might notice that the flow is downward
from the water table to
the deep aquifer over most of the area, but that it is upward
near the Lake:
Drawdown
Ground-water levels not only change laterally and
vertically, but also in time. Short-term changes result from seasonal variations
in precipitation and recharge. Long-term changes result from pumping. Well pumping
at a constant rate causes water levels to drop, quickly at first, then more gradually.
For a given amount of pumping, the long-term drop is often less for a well in
a shallow, unconfined water-table aquifer than a deep confined aquifer because
the shallow wells can obtain part of their water from streams and lakes, which
causes water levels to stabilize. Sometimes, however, the drop can be less in
the confined aquifer than the shallow aquifer when the former is thicker and
can support more flow to the deep
well.
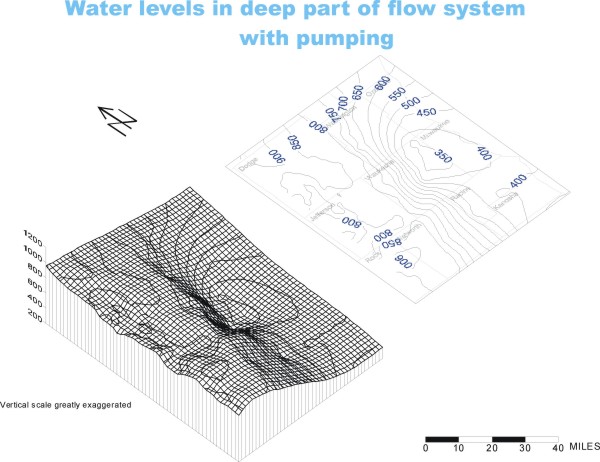
The next figure shows water levels in a deep aquifer
after over 100 years of pumping. The bowl-shaped surface is typical of how water-levels
drop around pumping centers where many water-supply wells are pumping:
The size of the drop relative to the average condition
before there was pumping is called drawdown. Just as water levels can be mapped
for different elevations in the ground-water system, so can drawdown be mapped
at the water table and for deeper horizons.
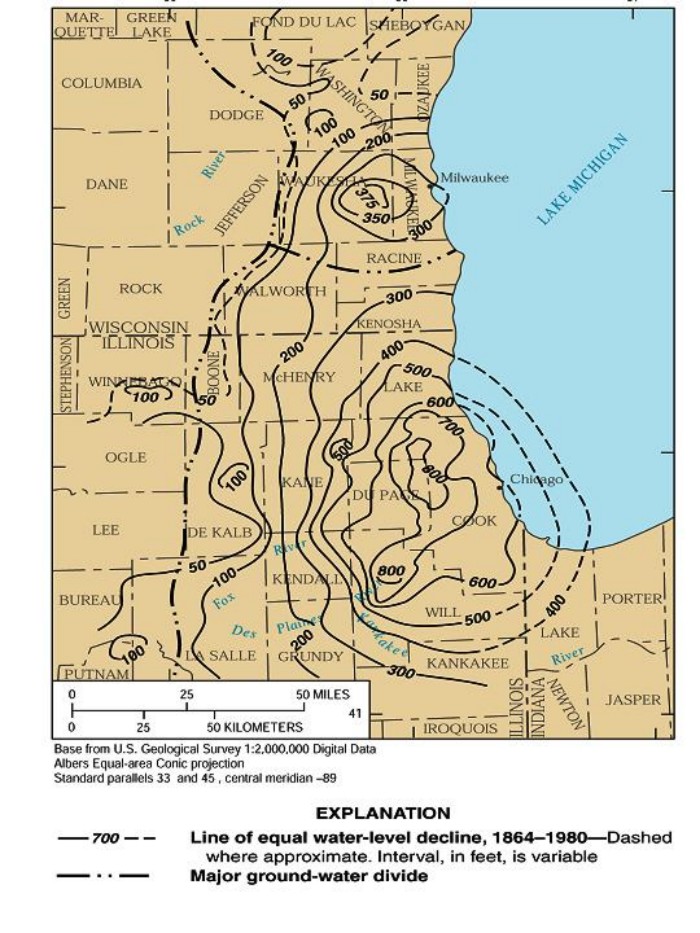
The pattern of drawdown around pumping centers is called
the "cone of depression". The map below shows the size of two large
regional cones of depression along Lake Michigan in 1980. The drawdown corresponds
to conditions in a deep aquifer system heavily used for water supply.
The cone of depression around Chicago reached its
deepest level in the early 1980s before Lake Michigan replaced some of the pumped
ground water as a source of drinking water. At its center, the drawdown exceeded
800 ft in 1980, a very large drop. It has rebounded somewhat since then.
In the area around Milwaukee-Waukesha, the maximum
drawdown at the center of the cone was almost 400 ft in 1980. In the subsequent
years, this cone has deepened and expanded.
To next concept --> Sources
of water to wells
return to top
|