|
 EFFECT
OF PUMPING ON GROUND-WATER FLOW LINES IN SOUTHEASTERN WISCONSIN EFFECT
OF PUMPING ON GROUND-WATER FLOW LINES IN SOUTHEASTERN WISCONSIN
 |
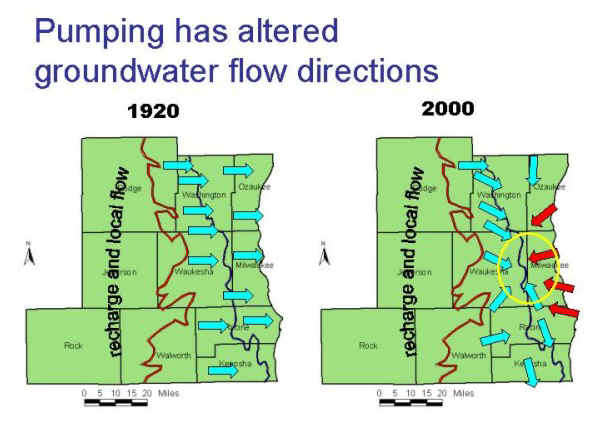
Schematic maps of deep flow directions in 1920 and
2000
(source: K.R. Bradbury, Wisconsin Geological and Natural
History Survey) |
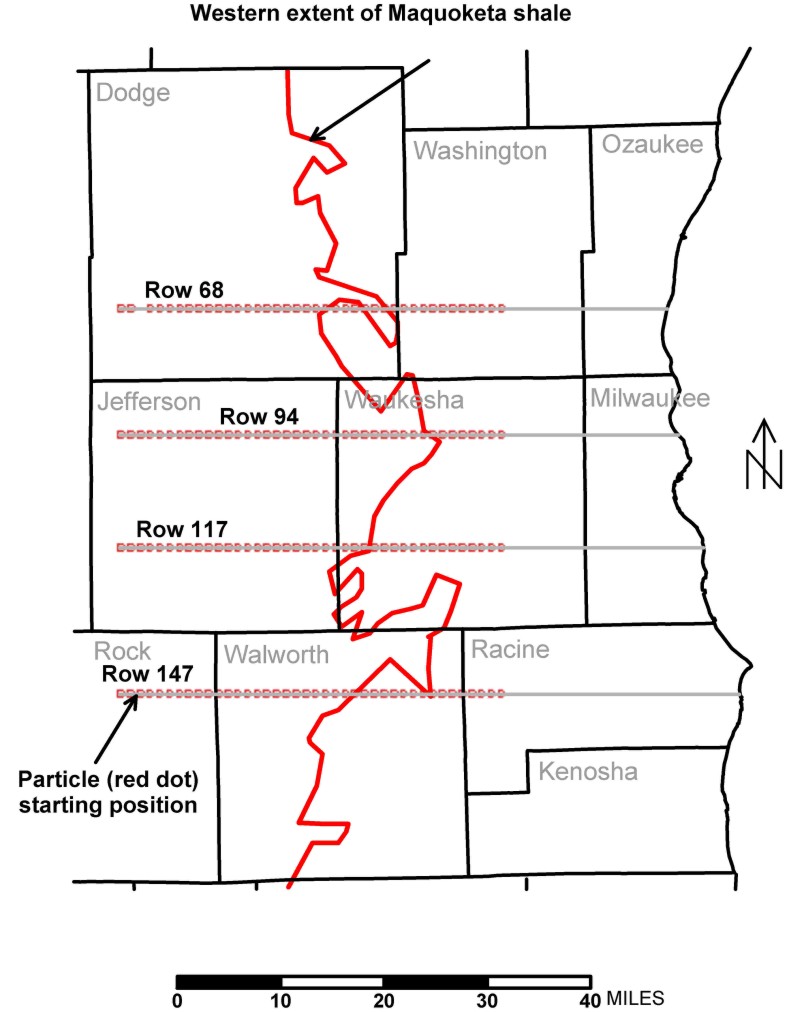
- Brown line corresponds to western extent of Maquoketa shale.
- Blue line corresponds to subcontinental divide.
- Blue arrows indicate flow originating as recharge to the water table.
- Red arrows indicate flow from below Lake Michigan toward pumping centers.
|
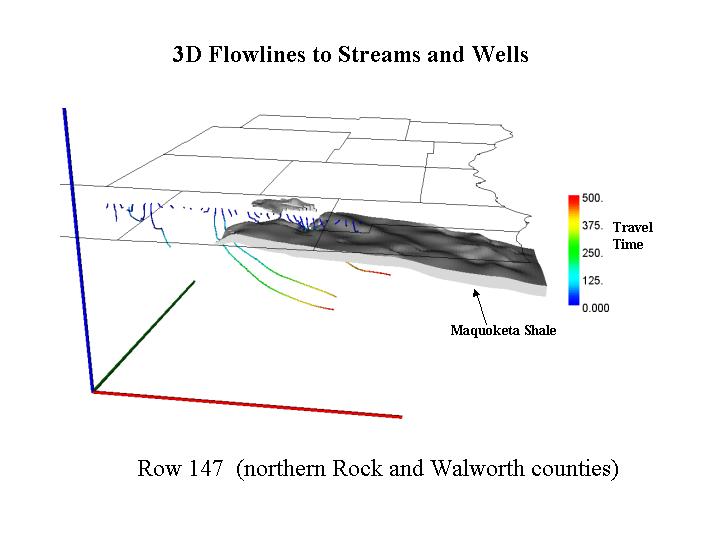
Ground water typically travels short distances over
relatively short time spans when it discharges to local streams. It generally
travels long distances over long time spans when it discharges to deep wells
open to the sandstone aquifer. The three-dimensional flow lines followed by ground
water from the water table to its destination can be visualized through a modeling
technique called "particle
tracking". Particle tracking simulates the movement of imaginary mathematical
particles through the ground-water system in response to the geometry, aquifer,
properties, and stresses input to the model. It is possible to use the mathematical
particles to estimate not only the configuration of ground-water flow lines,
but also the relative times of travel between the water table where the ground
water is recharged and its discharge point at a stream or well.
Selected three-dimensional paths followed from the water table to deep wells
are illustrated in a VIDEO CLIP (2436 kb) based
on the ground-water flow model results. Another view of the same flow lines,
viewed from south to north, is shown in a second VIDEO
CLIP (3052 kb). In both video clips the vertical lines correspond to
well locations and the colors along the flow lines correspond to relative times
of travel. The color-coded values indicate the minimum estimated travel time
in years.
The model provides snapshots of ground-water flow lines
that originate as recharge to the water table. The following plots show flow
lines corresponding to 2000 conditions (assuming that these conditions hold constant
over time) for water entering the ground-water system along four east-west lines
that span southeastern Wisconsin:
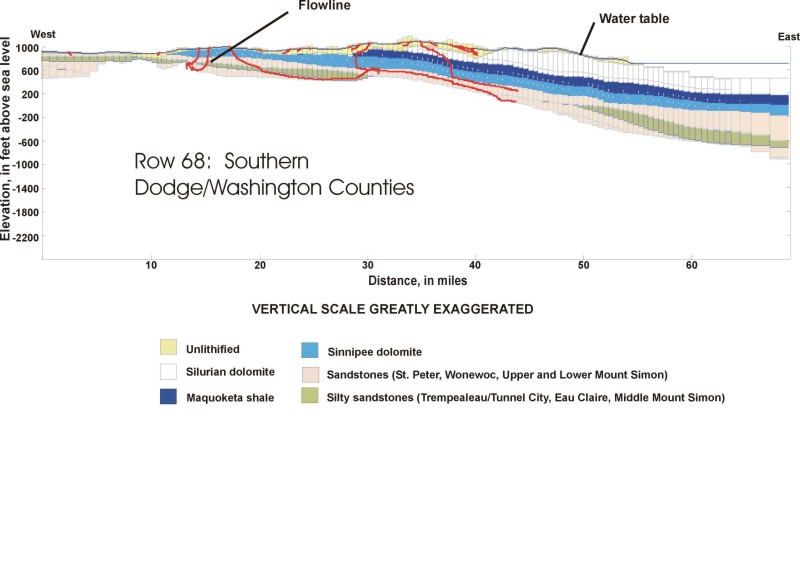
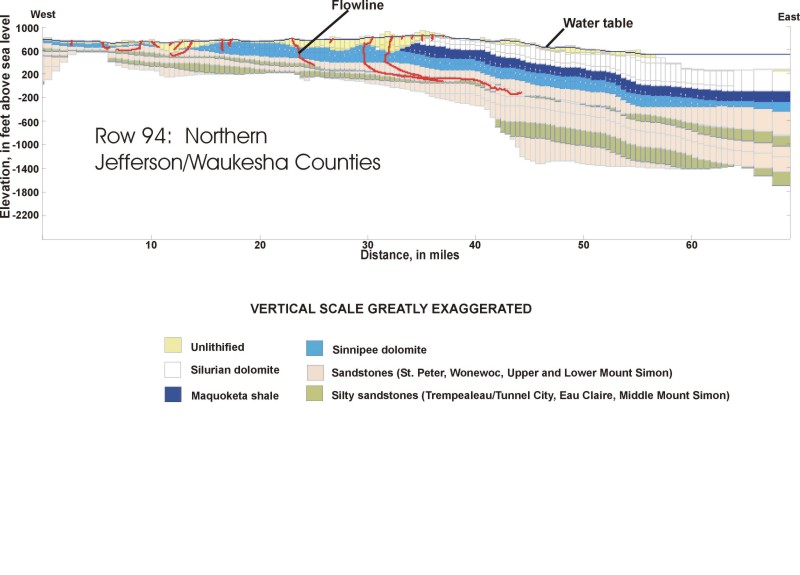
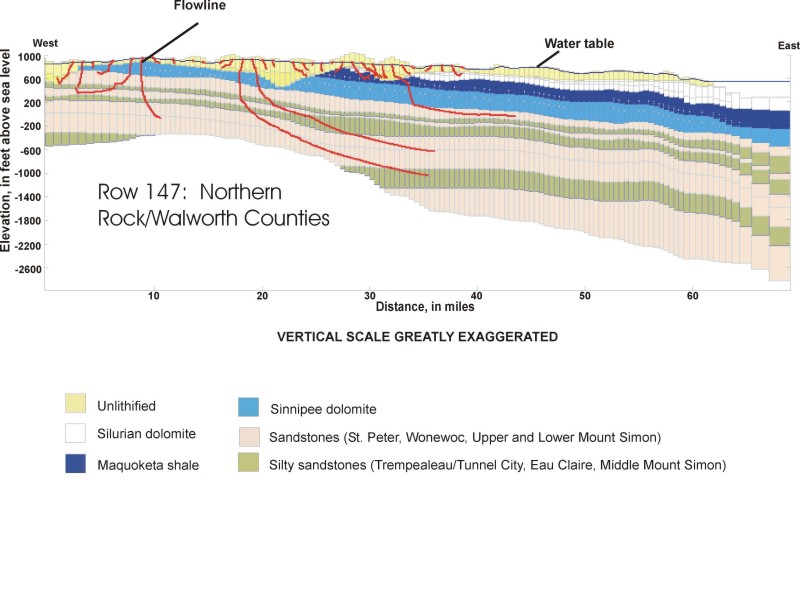
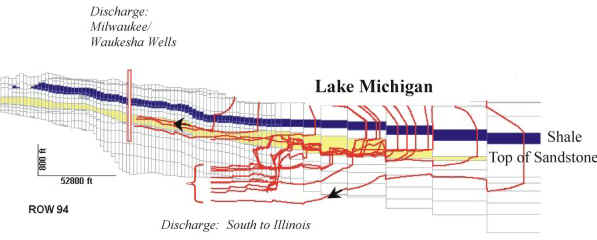
In the following 2D plots selected flow lines are projected against geologic
sections to show the relation of ground-water circulation to aquifers and aquitards.
Although most flow lines from the water table circulate relatively short distances
to local water bodies, these plots highlight flow lines from areas where recharge
to the water table circulates long distances to deep wells:
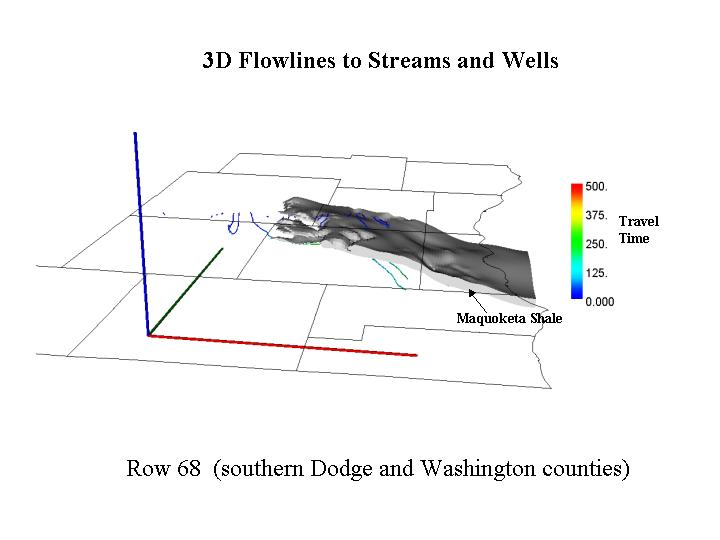
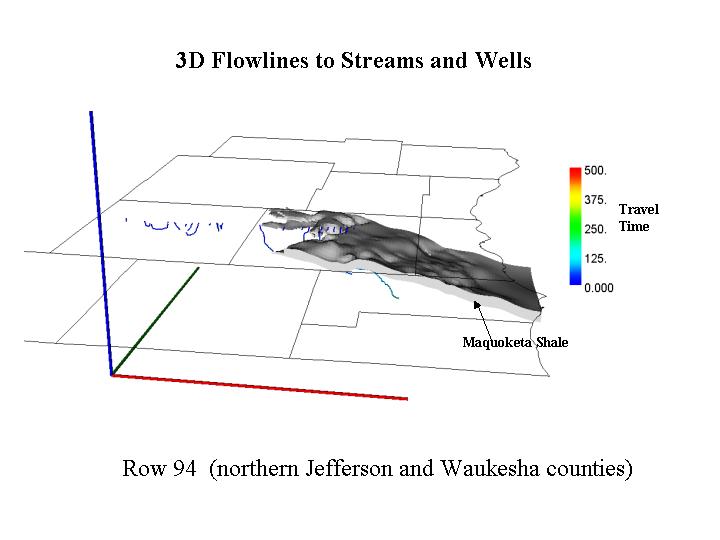
In the following 3D plots selected flow lines are shown in relation to the
Maquoketa shale with an indication of the time of travel along each path:
Before pumping ground-water flow lines were directed everywhere toward Lake
Michigan. Today deep flow is reversed and moves from the Lake toward pumping
centers:
However, this figure does not tell the whole story. Most of the flow that
moves toward wells from beyond the Lake shore does not originate as Lake water,
but rather is derived from water already stored in deep rocks below the shale.
In this sense, the wells are withdrawing ground water that originated hundreds
if not thousands of years ago as precipitation over land, entered the flow system
as recharge, and migrated eastward over long flow paths to be stored below the
Lake.
So much for the relation of deep ground water to Lake Michigan. Shallow
ground water has its own story.
return to top
|


